ContentGrowers.

Original research

Data-backed studies on what actually works in LinkedIn and content marketing.

We collect the posts, crunch the numbers and show our method, so you can stop guessing.

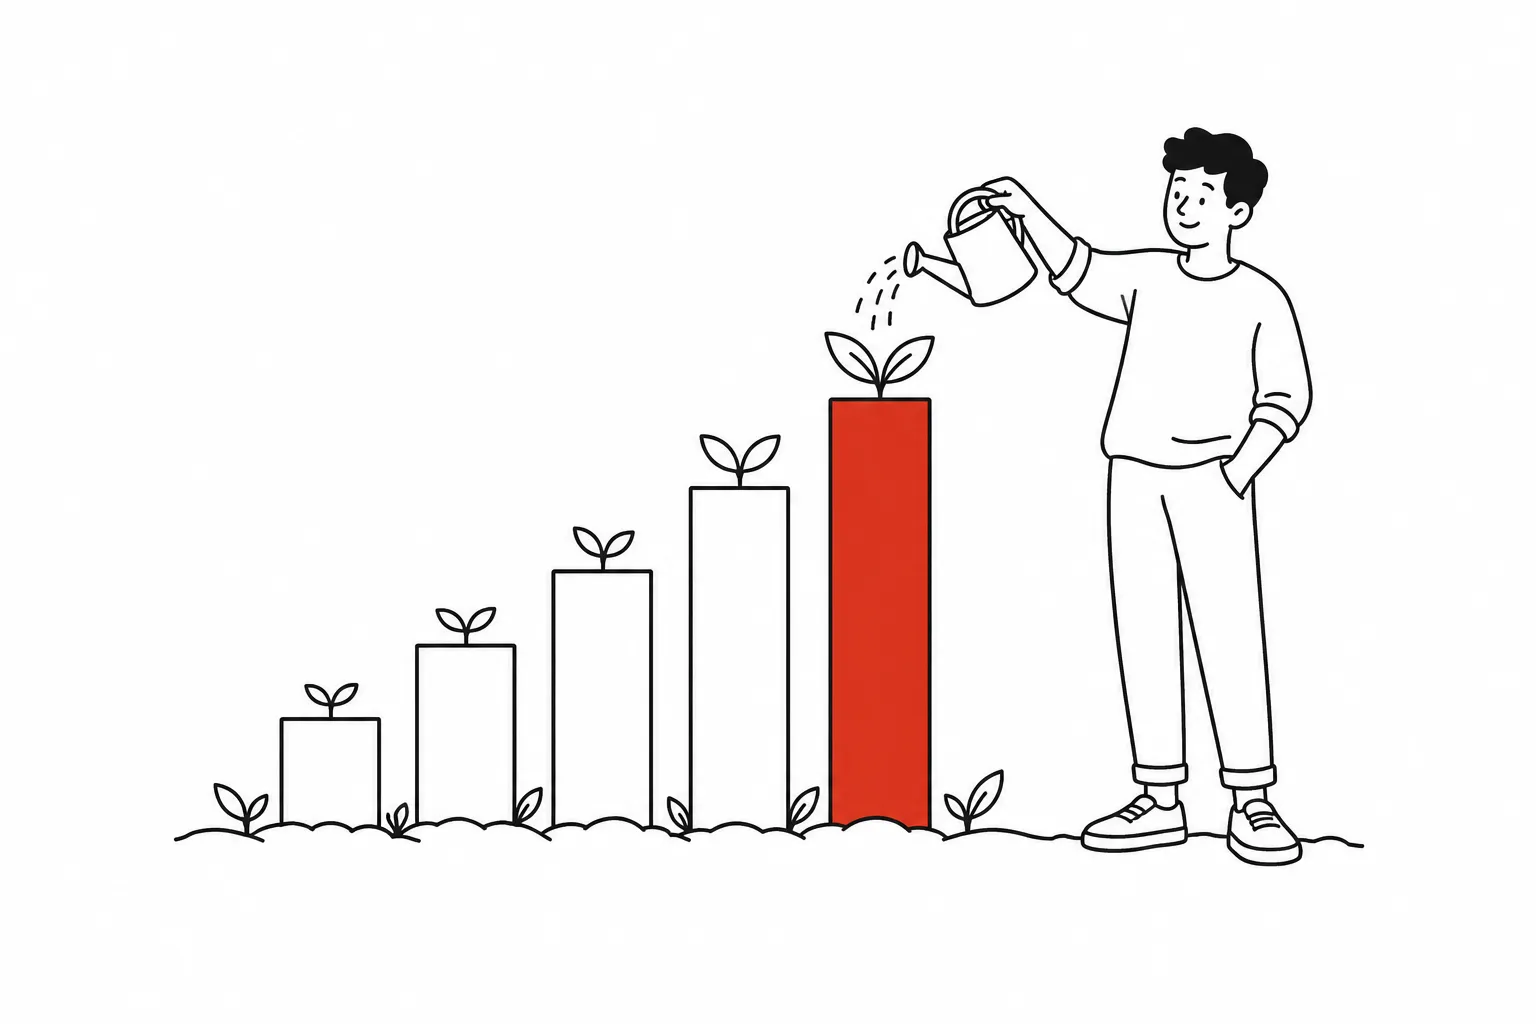
A person watering a bar chart that grows like a garden, the tallest bar in red

One email per new study. No roundups, no fluff.

Share of posts by hour, local time

Share of posts by hour, local time. 5a: 8%, 6a: 12%, 7a: 23%, 8a: 25%, 9a: 8%, 10a: 5%, 11a: 4%, 12p: 5%, 1p: 3%, 2p: 3%, 3p: 2%, 4p: 2%. n = 50 profiles · Jan–Jun 2026.

LinkedIn50 profiles · 4,200 posts

We analyzed 50 top LinkedIn creators: here's when they post

68%post before 9am

Six months of posts, timestamped in each creator's local time. The early slot wins, but not for the reason most people think.

Read the study: We analyzed 50 top LinkedIn creators: here's when they post →

Who's behind this

I'm Alan, a LinkedIn ghostwriter and B2B content strategist. I write LinkedIn posts and blog articles for founders and consultants, and I started ContentGrowers to test what actually works instead of guessing.

More about me →

How every study is made

  1. 01

    Collect

    Pull a defined sample of real posts, pages or survey answers.

  2. 02

    Clean

    Drop duplicates and outliers, and write down every rule we used.

  3. 03

    Analyze

    Run the numbers and check whether the pattern holds up.

  4. 04

    Publish

    Share the findings, the charts and the full method.

Get the next study first.

The data, the chart and the method, straight to your inbox.